
Top 7 Observability and APM Tools in 2026
Datadog, Grafana, Dynatrace, Splunk, New Relic, Chronosphere and Honeycomb compared on coverage, OpenTelemetry support and what each one actually costs.

Who this is for: platform, SRE and engineering teams choosing an observability platform in 2026 — and anyone whose APM bill grew faster than their traffic. Two things changed this year: Palo Alto Networks closed its $3.35B acquisition of Chronosphere in January, and Grafana Labs filed to go public. Pricing models, not feature checklists, are now the thing that separates these tools.
The strongest APM tools and observability platforms in 2026 are Datadog (broadest coverage), Grafana Labs (open-source and lowest cost at scale), Dynatrace (automated root cause for large enterprises), Splunk Observability Cloud (log-heavy estates), New Relic (predictable ingest pricing), Chronosphere (metrics cost control), and Honeycomb (high-cardinality debugging). All seven speak OpenTelemetry, so the real decision is how each one bills you — per host, per GB, per event, or per capability unit — and how that maps to the shape of your telemetry.
How we picked these
Four criteria, applied in this order:
- Production adoption — verifiable revenue, customer counts or install base, not marketing claims.
- Telemetry coverage — metrics, logs, traces and profiles in one place, with native OpenTelemetry ingest rather than a proprietary-agent-only path.
- Pricing transparency — is list pricing published, and can you predict a bill before you sign?
- A distinct job it does better than the others — we dropped anything that was a weaker version of a tool already on the list.
We scoped this to general application and infrastructure observability. Tooling aimed specifically at LLM applications is a separate market, covered in our LLM observability and tracing roundup.
Ranking runs from broadest general-purpose capability to most specialised. It is not a quality ordering: #7 is the right answer for some teams and #1 is the wrong answer for others. All pricing and feature claims are as of September 2026.
Quick comparison
| Company | Best for | Deployment | Pricing model |
|---|---|---|---|
| Datadog | Broadest single-vendor coverage | SaaS | Per host, per GB, per module |
| Grafana Labs | Open source and cost control at scale | SaaS, self-hosted, OSS | Consumption (series, GB) |
| Dynatrace | Automated root cause in large estates | SaaS, managed on-prem | Capability units (DPS) |
| Splunk Observability Cloud | Log-heavy enterprises on Cisco networks | SaaS | Per host, per month |
| New Relic | Predictable, ingest-based billing | SaaS | Per GB ingested + per user |
| Chronosphere | Metrics cardinality and cost control | SaaS | Pricing on request |
| Honeycomb | High-cardinality trace debugging | SaaS | Per event ingested |
1. Datadog
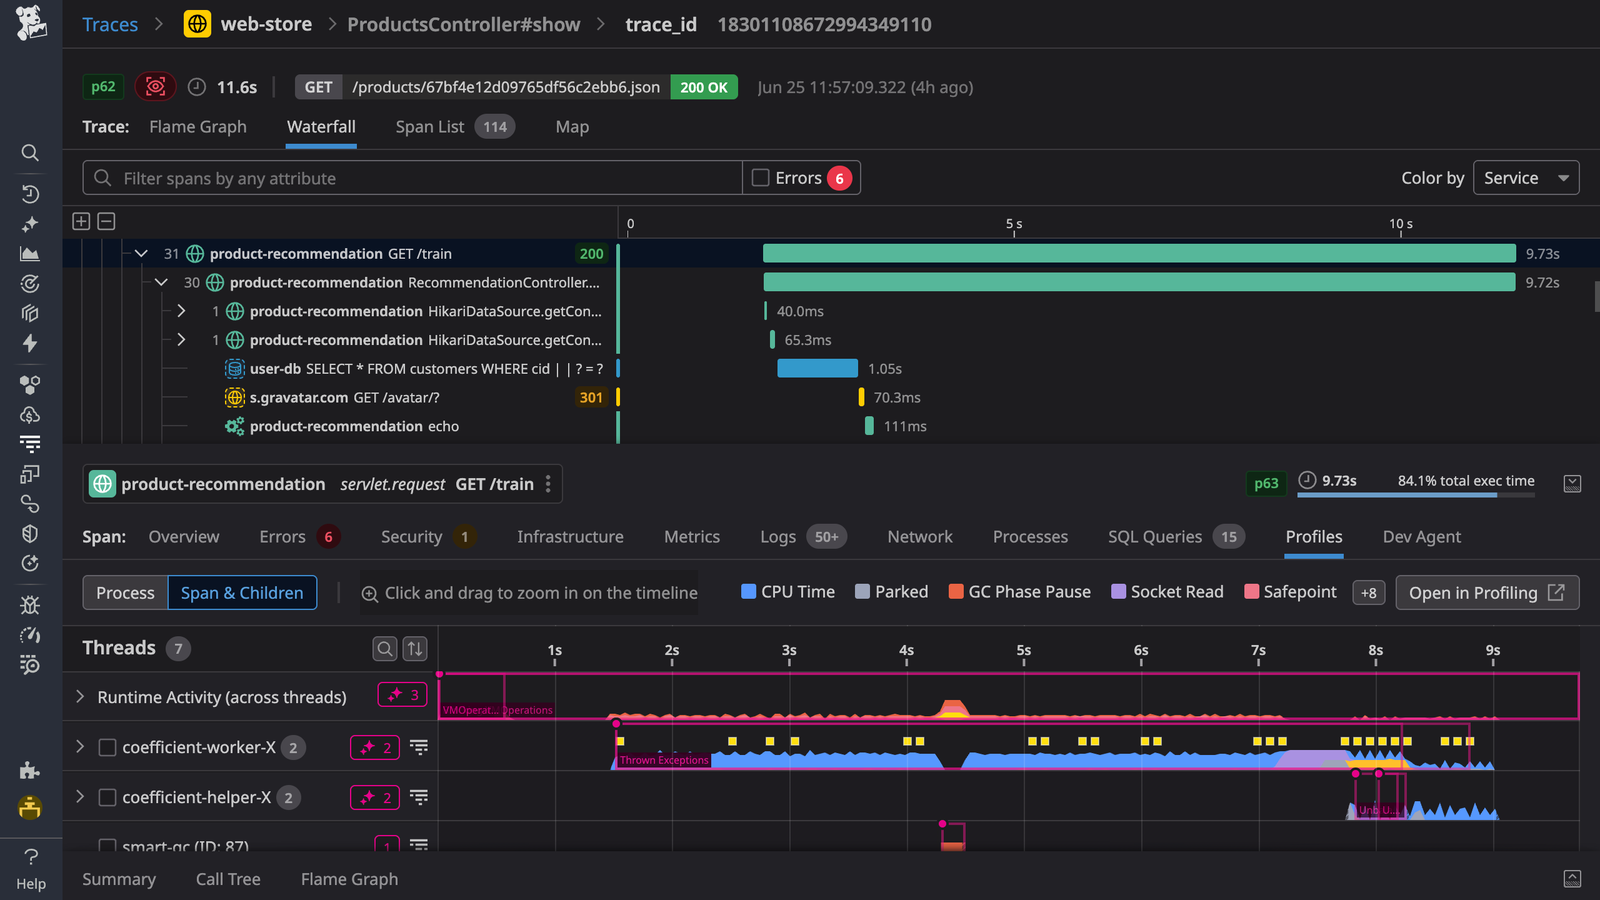
Datadog is the widest single-vendor footprint in the category — more than 30 product modules spanning infrastructure monitoring, APM, log management, real user monitoring, synthetics, database monitoring, security and cloud cost. That breadth is the product: most teams buy Datadog to stop running four tools.
It reported $1.12 billion in revenue in Q2 2026, up 36% year over year, with roughly 4,720 customers paying $100,000 or more in ARR, per its Q2 2026 results. Trailing net revenue retention sat in the low 120s, which tells you customers expand usage rather than churn.
The catch is the billing model. Each module meters separately, and host counts are sampled hourly and billed near the monthly peak rather than the average — so an autoscaling spike sets your bill for the month.
Best for: teams that want one vendor for everything and have budget headroom.
Pros
- Broadest module coverage of any vendor here; almost no telemetry type is missing.
- Published list pricing: $15/host/month for Infrastructure Pro and $31/host/month for APM on annual commitment.
- Native OpenTelemetry ingest alongside its own agent, so you are not forced into proprietary instrumentation.
- Largest integration catalogue in the category, which shortens onboarding for common stacks.
Cons
- Costs compound across modules — enabling APM, logs and RUM on the same fleet multiplies the per-host figure several times over.
- High-water-mark host billing punishes bursty autoscaling workloads.
- Custom metrics are billed separately and are a frequent source of unexpected overage.
- No self-hosted option; regulated workloads that cannot ship telemetry off-premises are out of scope.
2. Grafana Labs
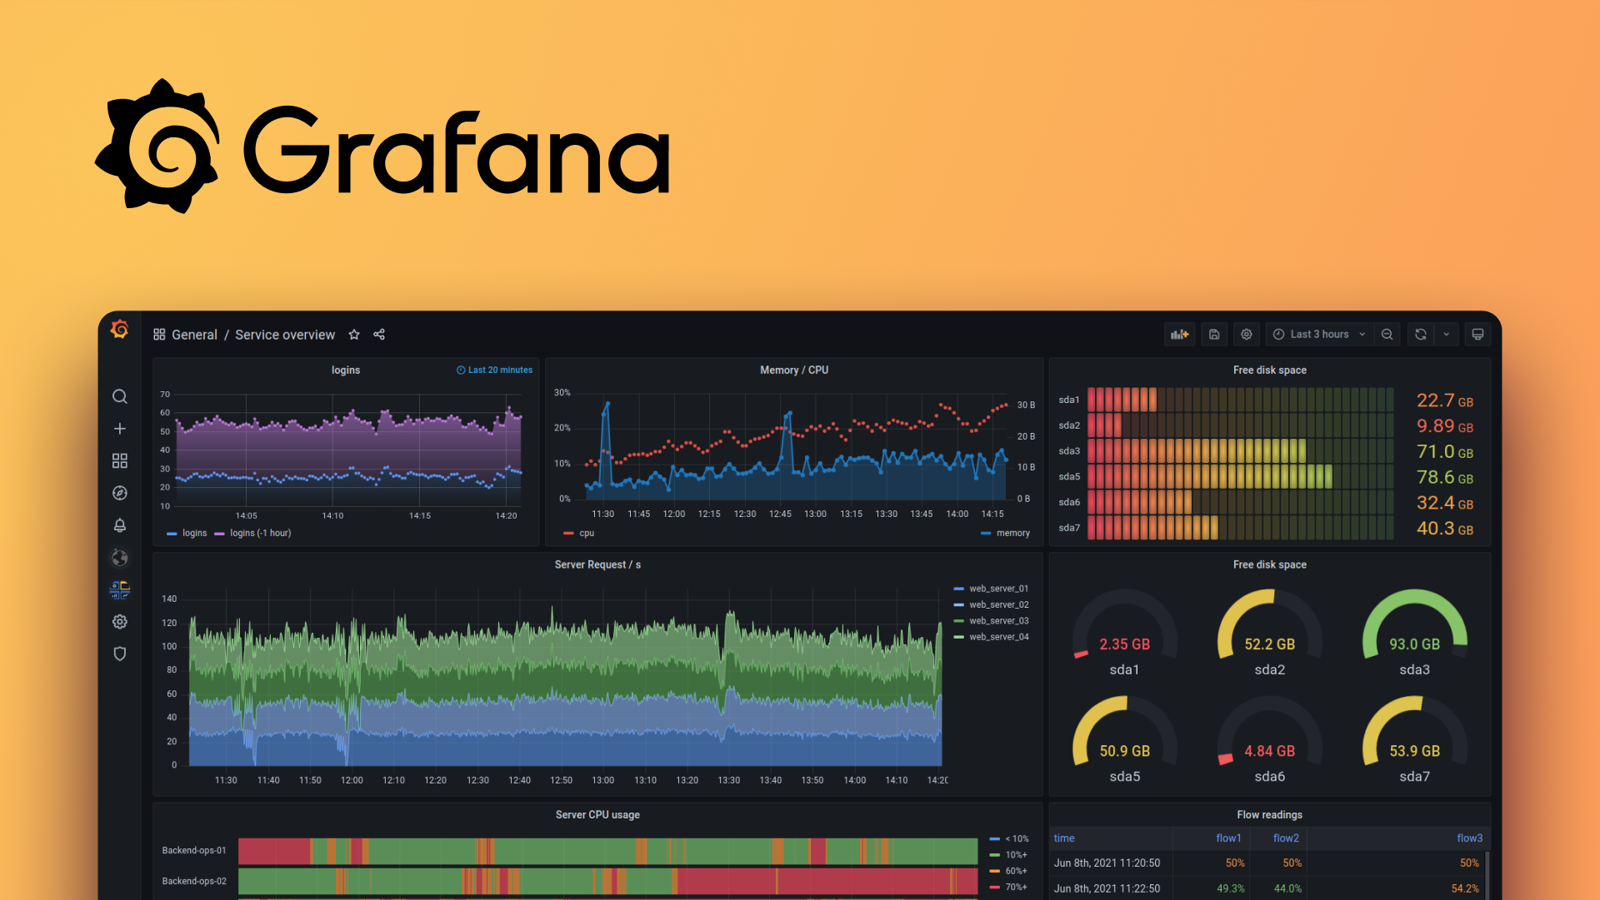
Grafana Labs builds the visualisation layer most of this industry standardised on, plus the LGTM backend stack: Loki for logs, Grafana for dashboards, Tempo for traces and Mimir for metrics, with Pyroscope for continuous profiling. Every component is open source and can be self-hosted, which is the structural difference from everything else on this list.
The company reported roughly $605 million in ARR as of August 2026 and more than 5,000 paying customers, and has filed an S-1 for a 2026 IPO. Grafana Cloud is the managed version; Grafana Enterprise is the self-managed commercial tier.
Grafana Cloud bills on consumption — active metric series, log and trace GB ingested, and seats — with a free tier generous enough for small teams to run production on it.
Best for: teams that want to control observability spend and are willing to own more operations.
Pros
- The full backend stack is open source and self-hostable; Grafana OSS is AGPLv3-licensed.
- Consumption pricing decouples cost from host count, which suits container-dense and autoscaling fleets.
- Vendor-neutral by design — Grafana dashboards read from Prometheus, Elasticsearch, Datadog and dozens of other sources.
- Genuine exit path: telemetry stays in open formats, so migrating off is a config change rather than a re-instrumentation project.
Cons
- Self-hosting Mimir and Loki at scale is real operational work — sizing, sharding and retention tuning are on you.
- The experience is assembled from separate components rather than unified, so correlation across signals takes more configuration than in Datadog or Dynatrace.
- Active-series billing on Grafana Cloud can surprise teams with high-cardinality Kubernetes labels.
- Less mature automated root-cause analysis than the enterprise incumbents.
3. Dynatrace
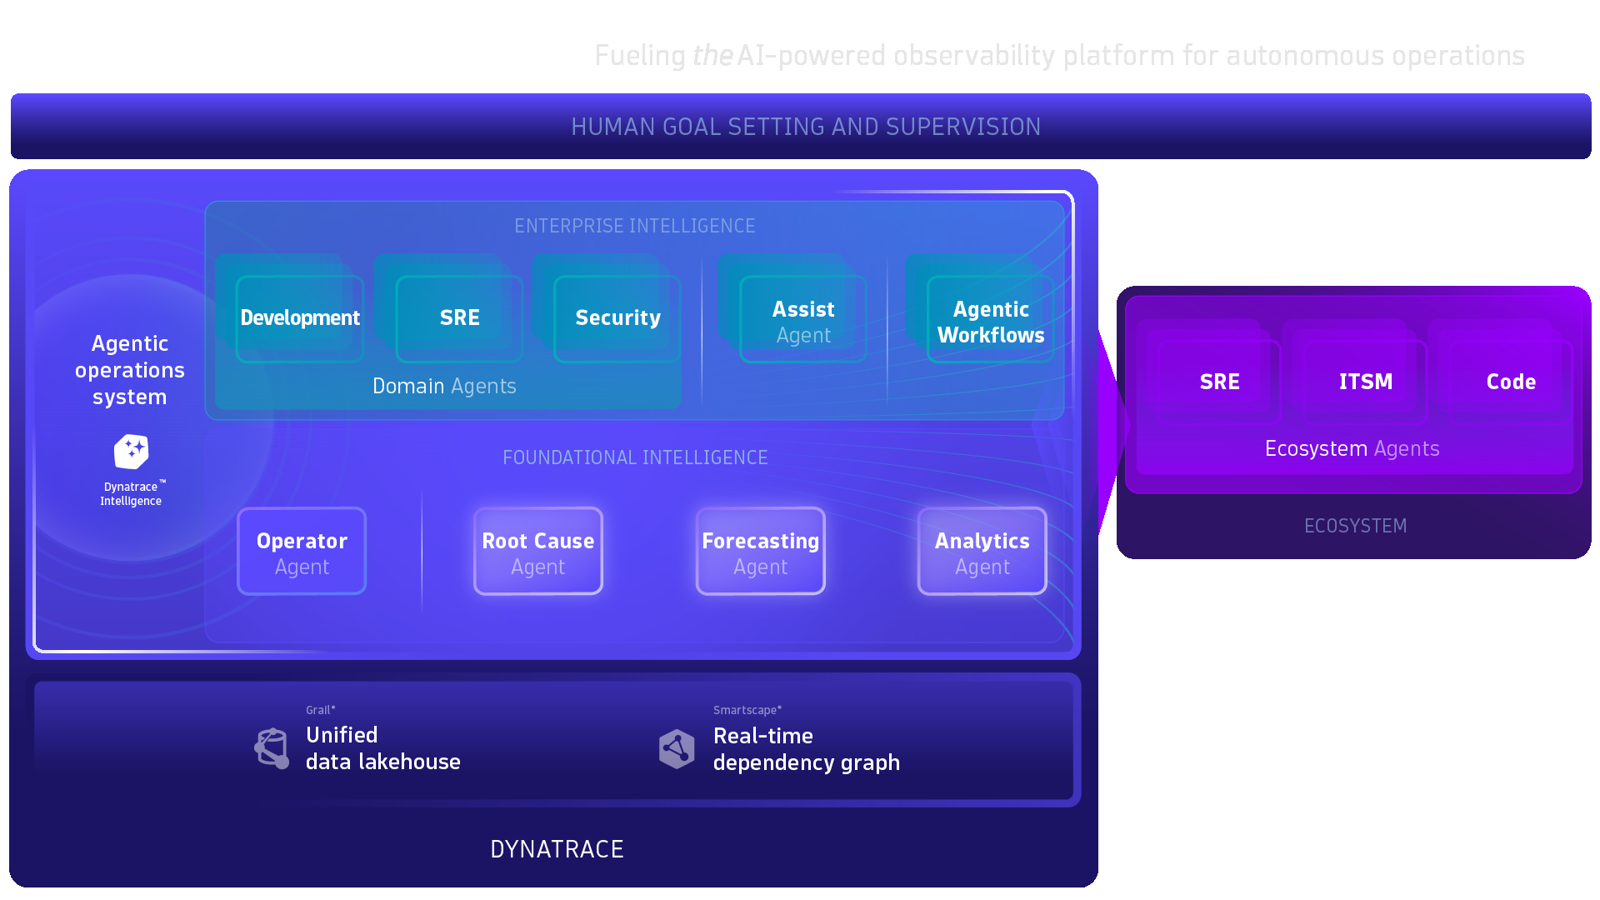
Dynatrace takes the opposite approach to Grafana: heavy automation, one agent, one causal model. Its OneAgent discovers services automatically, and Smartscape builds a live topology of dependencies. Davis, its analytics engine, uses that topology to name a probable root cause rather than showing you correlated graphs and leaving the inference to you.
It reported $477 million in Q1 FY2026 revenue, up 20% year over year, with ARR of $1.822 billion. The company says its consumption-based Dynatrace Platform Subscription now accounts for over 65% of ARR.
DPS replaces per-host SKUs with capability units drawn from a committed pool, which is more flexible than seat licensing but harder to model before you have usage data.
Best for: large enterprises that want automated root cause rather than manual investigation.
Pros
- Causal root-cause analysis built on an automatically maintained dependency topology, not just statistical correlation.
- Single-agent deployment reduces instrumentation effort across large heterogeneous estates.
- Available as SaaS or Dynatrace Managed, so on-premises and sovereign deployments are supported.
- Application security scanning is integrated into the same agent and platform.
Cons
- Capability-unit pricing is difficult to forecast; effective per-host cost is typically higher than the entry-level competitors here.
- The automation is opinionated — teams wanting to define their own analysis logic find it constraining.
- OpenTelemetry support exists but the platform is clearly optimised for OneAgent instrumentation.
- Enterprise sales motion with no realistic self-serve path for small teams.
4. Splunk Observability Cloud
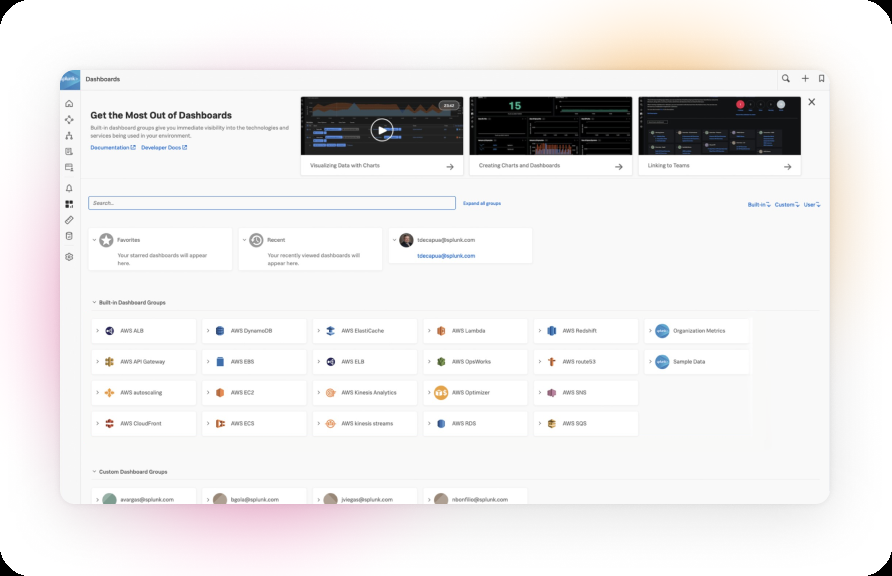
Splunk is now Cisco's observability arm, and Cisco has consolidated AppDynamics, the Splunk platform, Observability Cloud and IT Service Intelligence into a single Splunk Observability portfolio. The distinctive asset is Splunk's log analytics engine, which predates the observability category and still handles search over very large unstructured log estates better than most purpose-built tracing tools.
The second distinctive asset is network telemetry. Integration with Cisco ThousandEyes lets you separate an application regression from an internet or network path problem — a correlation the other vendors here cannot make natively.
Pricing is host-based and published: Infrastructure from $15/host/month, App & Infrastructure from $60/host/month, and End-to-End from $75/host/month, all billed annually. AppDynamics is licensed separately, from $6 per vCPU per month.
Best for: enterprises already running Splunk for logs or Cisco for networking.
Pros
- Published per-host list pricing across three clear tiers, unusual at the enterprise end of this market.
- Log search at petabyte scale remains a genuine differentiator.
- Native correlation with Cisco ThousandEyes network path data.
- Real-time streaming metrics architecture with sub-second alerting.
Cons
- The portfolio is still three or four products stitched together; AppDynamics and Observability Cloud overlap and are licensed apart.
- Splunk platform licensing is separate again, so total cost is rarely just the host-based number.
- Post-acquisition roadmap consolidation has been slow, and product naming remains confusing.
- Heavier operational and administrative overhead than SaaS-native competitors.
5. New Relic
New Relic rebuilt its commercial model around data volume rather than hosts or agents, and that remains the clearest reason to pick it. Every capability — APM, infrastructure, logs, browser, mobile, synthetics — is included; you pay for GB ingested plus billable users.
The published rate is 100 GB of free ingest per month, then $0.40/GB on the original data option or $0.60/GB with Data Plus, which adds longer retention. Users are tiered: basic users are free, core users are $49/user/month, and full platform users are $349/user/month on annual commitment.
The company was taken private by Francisco Partners and TPG in a $6.5 billion deal that closed in November 2023, and no longer publishes quarterly financials.
Best for: teams that want one predictable bill tied to telemetry volume, not fleet size.
Pros
- One usage meter across the whole platform; no per-module SKUs to reconcile.
- Genuinely usable free tier — 100 GB per month and one full platform user, indefinitely.
- Ingest-based billing is unaffected by container churn or autoscaling spikes.
- Strong OpenTelemetry support, including OTLP ingest without a proprietary agent.
Cons
- Full platform user seats at $349/month are expensive for large engineering orgs; costs shift from hosts to headcount.
- High-volume log estates get expensive fast at $0.40–$0.60/GB without aggressive filtering.
- As a private company it discloses no financials, so assessing momentum is guesswork.
- Query language (NRQL) is proprietary, which adds lock-in at the dashboard and alerting layer.
6. Chronosphere
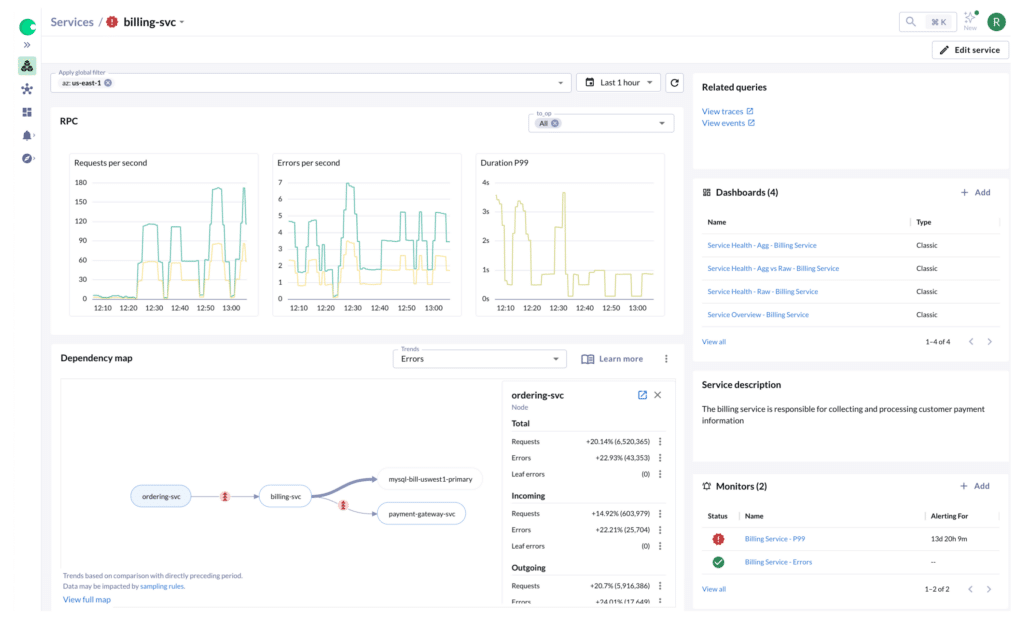
Chronosphere was built for one problem: observability data growing faster than the value extracted from it. Its Control Plane lets you shape, aggregate and drop telemetry before it is stored, and its Telemetry Pipeline (built on Fluent Bit, which the company acquired with Calyptia) does the same for logs in transit. Lens is the query and investigation interface.
Palo Alto Networks completed its $3.35 billion acquisition of Chronosphere on 29 January 2026, and reports the business passed $300 million in ARR within two quarters of joining. The stated plan is to connect the platform to Palo Alto's Cortex agentic remediation tooling.
Pricing is not published — expect an enterprise quote based on ingested and persisted data volume.
Best for: organisations whose Prometheus metrics cardinality has outgrown their budget.
Pros
- Cost controls operate before storage, so you reduce spend rather than just observing it.
- Prometheus and OpenTelemetry native, with no proprietary agent requirement.
- Telemetry Pipeline works as a vendor-neutral router — you can send filtered data to other backends.
- Named a Leader in Gartner's Magic Quadrant for Observability Platforms for three consecutive years.
Cons
- No published pricing and no self-serve tier; every deployment starts with a sales conversation.
- Narrower product surface than Datadog or Dynatrace — this is not an all-in-one suite.
- Now owned by a security vendor, and roadmap priorities may follow Palo Alto's platform strategy rather than observability buyers'.
- Aimed at large-scale estates; the cost-control value proposition does not apply below a certain telemetry volume.
7. Honeycomb
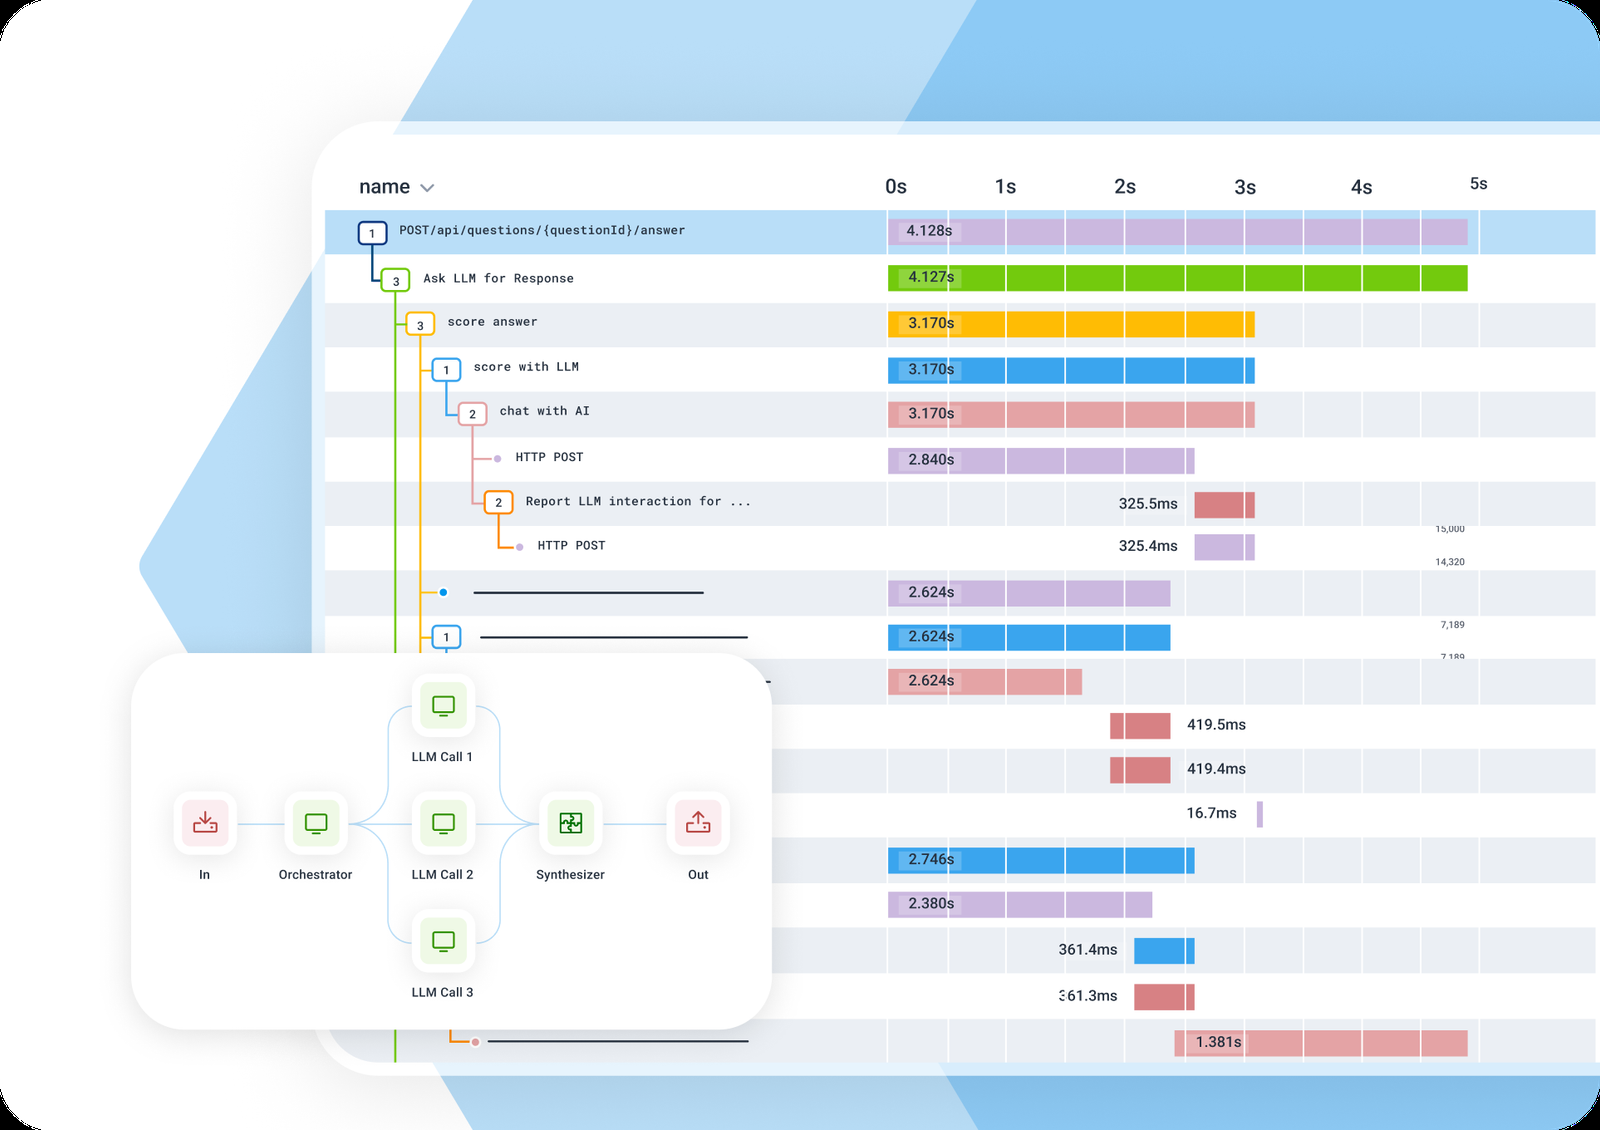
Honeycomb treats observability as debugging rather than dashboarding. It stores wide, structured events with arbitrarily high cardinality — user IDs, request IDs, feature flag values, build SHAs — and lets you slice by any of them after the fact. BubbleUp automates the comparison, showing which field values are over-represented in a slow or failing slice.
The company built its product on OpenTelemetry before most competitors did, and ships Refinery for tail-based sampling. Honeycomb Metrics reached general availability in March 2026, closing the most commonly cited gap in the product.
Pricing is per event ingested, with a free tier at 20 million events per month and Pro starting around $130 per 100 million events.
Best for: engineering teams debugging complex distributed systems, not ops teams watching dashboards.
Pros
- High-cardinality querying with no pre-aggregation or index planning required.
- Event-based pricing is straightforward to forecast if you know your request volume.
- OpenTelemetry-native from the start; no vendor agent to install.
- Refinery gives tail-based sampling control, which reduces cost without losing interesting traces.
Cons
- Narrowest scope on this list — no infrastructure monitoring, RUM or synthetics to speak of.
- Metrics support is only months old and less mature than the alternatives here.
- Event-based billing is awkward for high-throughput, low-value traffic like health checks.
- Requires teams to adopt wide-event instrumentation habits; retrofitting existing code takes real effort.
How to choose
Pick by billing shape and team size, not by feature matrix. Every platform here handles metrics, logs and traces adequately.
- You want one vendor and have budget. Datadog. Model the cost of every module you will enable, not just infrastructure.
- Your observability bill is the problem. Grafana Labs if you have platform engineers to run it; Chronosphere if you have scale but not spare operators.
- Large enterprise, limited SRE depth. Dynatrace. You are paying for automated root cause instead of headcount.
- Already deep in Splunk or Cisco. Splunk Observability Cloud, mainly for the ThousandEyes network correlation.
- Small fleet, large engineering team. New Relic's free 100 GB tier is the cheapest credible starting point — until seat costs bite.
- Debugging is the actual pain. Honeycomb, paired with something else for infrastructure monitoring.
One practical hedge regardless of choice: instrument with OpenTelemetry, not a vendor SDK. It is the only decision here that keeps switching costs low.
Two adjacent decisions usually land at the same time. If you are storing raw metrics yourself, the backend choice overlaps heavily with our time-series database comparison. And if observability is being folded into a broader self-service layer for developers, see our roundup of internal developer platforms. Teams evaluating runtime security alongside observability — increasingly the same conversation after the Palo Alto deal — should read our CNAPP platform comparison.
Frequently Asked Questions
What is observability?
Observability is the ability to understand a system's internal state from the telemetry it emits — metrics, logs, traces and profiles. The practical distinction from monitoring is that monitoring answers questions you predefined, while observability lets you ask new questions about failures you did not anticipate.
What is the difference between observability and monitoring?
Monitoring tracks known failure modes through predefined dashboards and alert thresholds. Observability supports open-ended investigation — querying high-cardinality data to diagnose problems nobody predicted. Most platforms on this list do both; Honeycomb and Chronosphere lean toward investigation, while Dynatrace and Splunk lean toward automated monitoring.
Is Datadog an observability tool?
Yes. Datadog covers metrics, logs, traces, profiles, real user monitoring and synthetics across more than 30 modules, which makes it the broadest observability platform available from a single vendor. It is billed per module, so total cost depends heavily on how many of those products you enable.
Which observability tools are open source?
Grafana's stack is the main open-source option: Grafana (AGPLv3), Loki for logs, Mimir for metrics, Tempo for traces and Pyroscope for profiling, all self-hostable. SigNoz and OpenObserve are smaller OpenTelemetry-native alternatives. OpenTelemetry itself is the open instrumentation standard all seven platforms support.
How much do observability tools cost?
List prices as of September 2026: Datadog from $15/host/month for infrastructure plus $31/host/month for APM; Splunk Observability from $15/host/month; New Relic at $0.40/GB ingested beyond 100 GB free, plus user seats; Honeycomb from roughly $130 per 100 million events. Chronosphere does not publish pricing.
Editor's note — sources: Datadog Q2 2026 results, Datadog pricing, Grafana Cloud pricing, Dynatrace platform, Splunk observability pricing, New Relic pricing, Palo Alto Networks on completing the Chronosphere acquisition, Chronosphere platform, Honeycomb pricing, New Relic take-private completion. Pricing and feature claims verified September 2026 and subject to change.